Data and its Interpretation


Data and its Interpretation
Data and its Interpretation:
Data interpretation means to arrange the numerical data so that it can be analysed for the purpose of arriving at an informed conclusion. Planning our future action depends on the analyses of the data. For example to analyse whether a concept has been understood by a class the analysis of marks obtained by the class for that concept is done. This is why proper analysis of the data should be done.
Data analysis tends to be extremely important aspect for any planning. That is to say, the nature and goal of interpretation will vary from business to business, likely correlating to the type of data being analyzed.
Recording Data:
The data is collected and recorded by the investigator with a definite objective in mind. For example in a class of 18 students a teacher wants to know the subject which maximum number of students like. The teacher will have to record the favourite subject of different students.For this the teacher will make a list with the name of the student and their favourite subject.
| S.No | Name of Student | Favourite Subject | S.No | Name of Student | Favourite Subject |
| 1 | Rohan | English | 10 | Seema | Maths |
| 2 | Rajesh | Sceince | 11 | Preeti | English |
| 3 | Raghav | Maths | 12 | Amar | Maths |
| 4 | Farida | Science | 13 | Ravi | English |
| 5 | Fatima | Science | 14 | Anita | Science |
| 6 | Satish | English | 15 | Supriya | Maths |
| 7 | Akhtar | Science | 16 | Sapna | English |
| 8 | Usha | English | 17 | Manoj | Maths |
| 9 | Ram | Maths | 18 | Neena | English |
Organisation of Data:
Once the data has been collected. Then the teacher has to organise the data to know the subject which is liked by most of the students.For this the teacher will count the number of times a particular subject appears in the list.
Maths : 6 times
Science : 5 times
English: 7 times
So the most favourite subject is English as it is occuring seven times.
Grouped Data:
Raw data is condensed into groups or classes in order to study their features.. Such a presentation is called grouped data.
Class Intervals:
Each of the group formed is called a class interval. Each class is bounded by two values which are called class limits.
For example in a class of 50 students a test is conducted comprising of 50 marks. The marks obtained by the student are considered as raw data.The marks are then arranged in groups known as class intervals. Let us say the groups are 0-10, 10-20, 20-30, 30-40 and 40-50 These are the class intervals
In class 20-30, 20 is the Lower Class Limit and 30 is called the Upper Class Limit.
Class Boundaries:
There are two types of class boundaries
1 Exclusive Form:
In this situation class interval is defined as Lower limit inclusive and the upper limit exclusive. That is for a class interval 20-30 the data value 20 is a part of this class but the data value 30 will lie in the next class.
2. Inclusive Form:
In this situation the true limit of a class is obtained by subtracting 0.5 from the lower limit of the class and the true upper limit of the class is obtained by adding 0.5 to the upper limit. That is for a class interval 20-30 the true lower limit will be 20-0.5=19.5 and true upper limit will be 30 + 0.5 = 30.5, so data value 19.5 and above will be a part of this class and the data value 30.4 will also be a part of this class but the data value 30.6 will lie in the next class.
The inclusive form of class boundary the value 19.4 will lie in ___________________class interval. | |||
| Right Option : A | |||
| View Explanation | |||
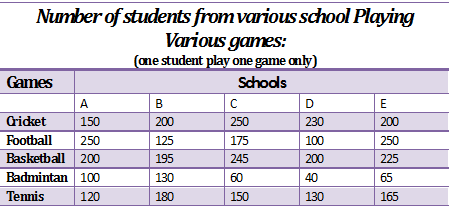
The number of students playing football from school C is x percents of the total number of students playing football from all the schools x equals _______________ | |||
| Right Option : B | |||
| View Explanation | |||
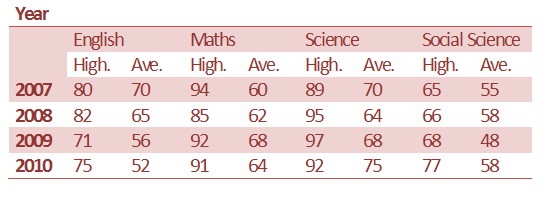
What is the overall average of marks in the four subjects in the year 2009 ?
| |||
| Right Option : A | |||
| View Explanation | |||
Students / Parents Reviews [10]
A marvelous experience with Abhyas. I am glad to share that my ward has achieved more than enough at the Ambala ABHYAS centre. Years have passed on and more and more he has gained. May the centre flourish and develop day by day by the grace of God.

Archit Segal
7thI have spent a wonderful time in Abhyas academy. It has made my reasoning more apt, English more stronger and Maths an interesting subject for me. It has given me a habbit of self studying

Yatharthi Sharma
10thAbout Abhyas metholodology the teachers are very nice and hardworking toward students.The Centre Head Mrs Anu Sethi is also a brilliant teacher.Abhyas has taught me how to overcome problems and has always taken my doubts and suppoeted me.

Shreya Shrivastava
8thBeing a parent, I saw my daughter improvement in her studies by seeing a good result in all day to day compititive exam TMO, NSO, IEO etc and as well as studies. I have got a fruitful result from my daughter.

Prisha Gupta
8thMy experience with Abhyas academy is very good. I did not think that my every subject coming here will be so strong. The main thing is that the online tests had made me learn here more things.

Hiya Gupta
8thAbhyas Methodology is very good. It is based on according to student and each child manages accordingly to its properly. Methodology has improved the abilities of students to shine them in future.

Manish Kumar
10thAbhyas is a complete education Institute. Here extreme care is taken by teacher with the help of regular exam. Extra classes also conducted by the institute, if the student is weak.

Om Umang
10thMy experience with Abhyas is very good. I have learnt many things here like vedic maths and reasoning also. Teachers here first take our doubts and then there are assignments to verify our weak points.

Shivam Rana
7thIt has a great methodology. Students here can get analysis to their test quickly.We can learn easily through PPTs and the testing methods are good. We know that where we have to practice

Barkha Arora
10thIt was a good experience with Abhyas Academy. I even faced problems in starting but slowly and steadily overcomed. Especially reasoning classes helped me a lot.